|
Creation
of Real World Test Signals for ATSC Mobile DTV Receiver Performance
Examined at NAB Show
 Each
year, presenters at the NAB Broadcast Engineering Conference are
urged to submit written papers on the subject of their presentations.
The yearly NAB Broadcast Engineering Conference Proceedings,
published as both a book and a CD-ROM, and sold at the NAB Store
in the Las Vegas Convention Center during the NAB Show - and at
www.NABStore.com after the
Show - is a compendium of these technical papers, and an important
archive of the leading edge of broadcast engineering issues. The
NAB Best Paper Award, established in 2010, honors the author(s)
of a paper of exceptional merit published in the Proceedings,
and is announced at the annual Technology Luncheon. At this year's
Show, the award was given for the paper "Creation of a Library
of RF Recorded Signals for ATSC Mobile DTV in a Single Frequency
Network Environment" authored by Charles Nadeau, Benoit Ledoux,
Yiyan Wu, Gilles Gagnon, Robert Gagnon and Sébastien Laflèche,
of the Communications Research Centre, Canada. The paper is excerpted
below. Each
year, presenters at the NAB Broadcast Engineering Conference are
urged to submit written papers on the subject of their presentations.
The yearly NAB Broadcast Engineering Conference Proceedings,
published as both a book and a CD-ROM, and sold at the NAB Store
in the Las Vegas Convention Center during the NAB Show - and at
www.NABStore.com after the
Show - is a compendium of these technical papers, and an important
archive of the leading edge of broadcast engineering issues. The
NAB Best Paper Award, established in 2010, honors the author(s)
of a paper of exceptional merit published in the Proceedings,
and is announced at the annual Technology Luncheon. At this year's
Show, the award was given for the paper "Creation of a Library
of RF Recorded Signals for ATSC Mobile DTV in a Single Frequency
Network Environment" authored by Charles Nadeau, Benoit Ledoux,
Yiyan Wu, Gilles Gagnon, Robert Gagnon and Sébastien Laflèche,
of the Communications Research Centre, Canada. The paper is excerpted
below.
INTRODUCTION
With the growing interest in Single Frequency Networks (SFN) as
a possible solution to increase reception coverage for mobile receivers
and handheld devices, it is desirable to have a reliable and repeatable
way of testing ATSC-M/H receivers' performance in mobile SFN environments.
One such way is to test the ATSC-M/H receivers by using a library
of well characterised RF captured field ensembles. The Communications
Research Centre Canada (CRC) took the initiative of working on such
a library, which contains RF captures of SFN mobile channels from
areas with various types of population density, vehicle speed and
carrier-to-noise ratio. This article describes how the RF captured
field ensembles were recorded, selected and evaluated. Furthermore,
this is followed by an analysis demonstrating how using real field
captures to test current generation ATSC-M/H receivers yield interesting
results that were not apparent during standard laboratory characterisation
of these receivers.
 ATSC-M/H
SFN TRANSMISSION SYSTEM ATSC-M/H
SFN TRANSMISSION SYSTEM
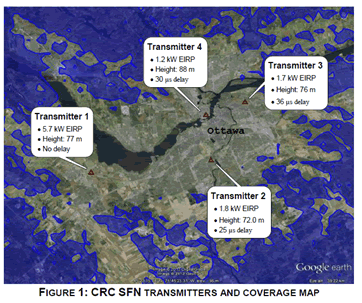
The transmission system used in the creation of the RF captured
field ensembles is a Single Frequency Network located in Ottawa,
Ontario, and operated by CRC for television broadcast research.
Four low-power transmitters cover the Ottawa region and transmit
the ATSC-M/H signal on UHF channel 46. Figure 1 illustrates the
topology and power output of the four transmitters, with lighter
areas indicating reception power over -80 dBm, as predicted by CRC-COVLAB
[1].
The synchronization delay at each transmitter was
set to minimize multipath spread in the downtown Ottawa area. Each
transmitter also broadcasts a watermark TxID injected at 30 dB below
the main signal, as per standard A/110 [2].
The ATSC-M/H signal carries three services, each with its own ensemble
and its own Serial Concatenated Convolution Code (SCCC) rate, as
described in standard A/153 [3]. All ensembles use the Reed-Solomon
parity of 48 bytes. The three services are identified as follows
throughout this paper:
· ½ Rate: All SCCC regions
are ½ rate coded
· ¼ Rate: All SCCC regions are ¼ rate
coded
· Mixed Rate: SCCC Region A is ½ rate coded.
Regions B, C and D are ¼ rate.
RF RECORDING FIELD CAMPAIGN
I. Selection of Areas of Interest
In order to build a library of diverse and representative RF captured
field ensembles, different areas of interest were identified within
the coverage of the Ottawa SFN. Areas of interests include regions
of densely populated areas with high rise buildings (urban areas)
and residential and low-density areas (suburban areas). Testing
areas were also chosen to have a variety of traffic conditions and
speed limits, from high traffic downtown streets to high speed freeways.
A preliminary power survey was first performed to determine the
reception power in each area of interest from each individual SFN
transmitter. From this information, test routes were created along
specific paths, under the following conditions: two or more transmitters
had to be operational; if a transmitter had an irrelevant or an
overwhelming (single transmitter equivalent) contribution along
the test route, it was turned off; and the relative receive power
from the active transmitters had to be within 10 dB of each other
along the chosen route. This ensured valid and challenging SFN reception
conditions for ATSC-M/H receivers.
II. System Setup and Methodology for RF Signal
Recording
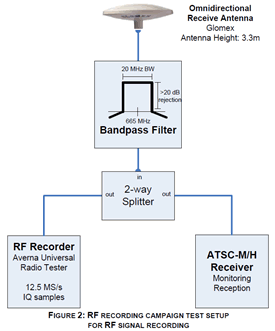 The
RF recording campaign was done using a well characterized test setup.
An omnidirectional antenna was installed on top of a test vehicle
at 3.3 meters from the ground. The antenna was connected to a bandpass
filter for channel 46 to prevent overloading the RF recorder front
end. The filter output was split in two to feed the RF recorder
input and an ATSC-M/H receiver to monitor reception. Figure 2
shows the block diagram of the test setup. The
RF recording campaign was done using a well characterized test setup.
An omnidirectional antenna was installed on top of a test vehicle
at 3.3 meters from the ground. The antenna was connected to a bandpass
filter for channel 46 to prevent overloading the RF recorder front
end. The filter output was split in two to feed the RF recorder
input and an ATSC-M/H receiver to monitor reception. Figure 2
shows the block diagram of the test setup.
Recording the
RF signal during the campaign simply involved driving along the
chosen routes in each region of interest, respecting speed limits
and road signalization. Depending on the area, the routes took between
2 to 25 minutes. Only the transmitters that were identified to produce
challenging SFN reception conditions for each test route were turned
on during a drive, as explained in the above section. The transmitters'
outputs were controlled remotely from the test vehicle. A monitoring
test site was also used to verify the transmitters' output power.
III. RF Recorder
Hardware Considerations and Setup
Capturing RF signals correctly involves using a test setup that
introduces he least amount of distortions to the captured signal
while preserving important signal characteristics such as fast power
variations and carrier-to-noise ratio (C/N). RF recorder hardware
has its limitations in that the tuner has a noise figure and the
digitizer has a limited dynamic range. A good recording system usually
uses a slow automatic gain control (AGC) to bring the signal within
optimal range of the digitizer, as to not overload the system and
to maximize C/N. However, this brings its own problems such as the
RF recorded power not being the real signal power when there are
fast power variations (like in a mobile environment) because the
AGC loop response time can impact the detected RF power. Moreover,
using an AGC also affects the RF recordings' noise floor for low-power
signals since the front end' noise floor becomes dominant and can
vary when the AGC chain of amplifiers and attenuators changes states
to respond to fast RF power variations that occur during mobile
reception.
With this in mind, it was deemed important for this library of RF
recordings to preserve signal power variations and to have a known
noise floor that would become the noise floor that eventual receivers
would see when the RF sequence would be played back. The RF recorder
was thus setup with a fixed front end gain so the operating dynamic
range at the digitizer is known and fixed. The system was then characterized
to know this noise floor and to know the maximum input RF power
without overloading the front end or the digitizer. This is a summary
of the RF recorder setup:
o Sampling
rate: 12.5 MS/s, IQ samples
o 10 MHz of effective bandwidth around the center frequency of 665
MHz (channel 46).
o No automatic gain control
o RF Recording Noise Floor: -94 dBm
o Maximum input power: -45 dBm
SELECTION
OF RF CAPTURED FIELD ENSEMBLES
Following the
campaign, six hours of raw RF recordings was available to build
the library of RF captures. A pre-analysis was done in order to
identify interesting portions within the raw data. It was decided
that the RF captures should be 2 minutes in duration to be able
to thoroughly analyse receivers' behavior over a mobile channel.
The analysis was based on a combination of the following three evaluation
characteristics considered over the 2 minutes duration:
o Carrier-to-Noise
ratio
o Multipath channel profile (impulse response)
o Reception performance of the RF recordings when the signal is
played back to a reference receiver.
After this pre-analysis,
approximately 150 candidate RF captures were identified. From this
pool of captures, the final selection was made to have a manageable
number of captures that would cover the range of reception difficulty
for all three services that were carried over the ATSC M/H signal.
Thus, there would be captures that should be difficult for a receiver
only for the ½ rate coded service, but easy for the more
robust modes, and so on. Table 1 describes the difficulty categories
that were used to classify the RF captures when testing them on
an ATSC-M/H receiver.
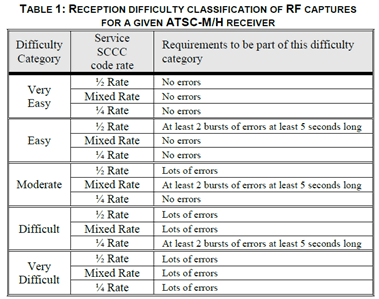
*A single small burst less than 5 seconds during
the RF playback is considered "No errors"
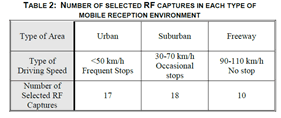 The
final selection for the library of ATSC-M/H RF recordings includes
45 RF captures of 2 minutes length each evenly spread across the
difficulty categories described in Table 1, considering reception
performance for the best mobile DTV receiver available. The 45 chosen
RF captures include many types of reception environments such as
urban and suburban building density and different types of road
speeds such as the stop-and-go drive of downtown areas, moderate
speeds with occasional stops of suburban areas and high speed freeway
drive. Table 2 shows how many RF captures fall in each general type
of reception environment. The
final selection for the library of ATSC-M/H RF recordings includes
45 RF captures of 2 minutes length each evenly spread across the
difficulty categories described in Table 1, considering reception
performance for the best mobile DTV receiver available. The 45 chosen
RF captures include many types of reception environments such as
urban and suburban building density and different types of road
speeds such as the stop-and-go drive of downtown areas, moderate
speeds with occasional stops of suburban areas and high speed freeway
drive. Table 2 shows how many RF captures fall in each general type
of reception environment.
The complete
paper is included in its entirety in the 2012 NAB Broadcast Engineering
Conference Proceedings, available online from the NAB Store
(www.nabstore.com). Other
technical papers related to mobile DTV published in the Proceedings
include the following:
DVB-T2-Lite:
A Second Wind for Mobile TV?, Peter Siebert, Executive Director,
DVB Project Office;
Elliptical
Polarization: Influences on the Performance of Digital TV Coverage,
Valderez Donzelli, MSC Engineer, Universidade Presbiteriana Mackenzie;
Mobile DTV
Status Report and Transmission Update,
Sterling Davis, Consultant, Open Mobile Video Coalition (OMVC);
Mobile DTV
as a Digital Radio Distribution Platform,
Joe Igoe, VP & Chief Tech Officer, WGBH.
Future
of Broadcast Television Initiative Announces Leadership
 Last
week's TV
TechCheck noted the official formation of the Future of
Broadcast Television (FOBTV) Initiative at the NAB Show, founded
by thirteen broadcast organizations around the world. On Wednesday
April 25, the FOBTV Management Committee announced its leadership
team. Mark Richer, President, Advanced Television Systems Committee
(ATSC), was named Chairman and Phil Laven, Chairman, Digital Video
Broadcasting (DVB) Project, was named Vice Chairman. Dr. Wenjun
Zhang, Chief Scientist, National Engineering Research Center of
DTV (NERC-DTV) of China, was named Chair of the Technical Committee.
Three Technical Committee Vice Chairs were also named: Dr. Yiyan
Wu, Principal Research Scientist, Communications Research Centre
(CRC) Canada, Dr. Toru Kuroda, Director of Planning and Coordination
Division, Japan Broadcasting Corporation (NHK) Science and Technology
Research Laboratories and Dr. Namho Hur, General Director, Department
of Broadcasting System Research, Electronics and Telecommunications
Research Institute (ETRI) of Korea. For more information, see
www.fobtv.org. Last
week's TV
TechCheck noted the official formation of the Future of
Broadcast Television (FOBTV) Initiative at the NAB Show, founded
by thirteen broadcast organizations around the world. On Wednesday
April 25, the FOBTV Management Committee announced its leadership
team. Mark Richer, President, Advanced Television Systems Committee
(ATSC), was named Chairman and Phil Laven, Chairman, Digital Video
Broadcasting (DVB) Project, was named Vice Chairman. Dr. Wenjun
Zhang, Chief Scientist, National Engineering Research Center of
DTV (NERC-DTV) of China, was named Chair of the Technical Committee.
Three Technical Committee Vice Chairs were also named: Dr. Yiyan
Wu, Principal Research Scientist, Communications Research Centre
(CRC) Canada, Dr. Toru Kuroda, Director of Planning and Coordination
Division, Japan Broadcasting Corporation (NHK) Science and Technology
Research Laboratories and Dr. Namho Hur, General Director, Department
of Broadcasting System Research, Electronics and Telecommunications
Research Institute (ETRI) of Korea. For more information, see
www.fobtv.org.
SBE
Webinar: TV White Space Devices and Wireless Microphones
Wednesday, May 2, 2012
2 - 3 p.m. EDT
The FCC is
now allowing unlicensed wireless devices to operate in vacant,
or TV White Space, channels as well as accommodating unlicensed
microphone use. This webinar
provides an overview of what the FCC has authorized for unlicensed
devices and how this will impact the daily operations of a broadcaster,
news organization or production company.
Presenting this webinar is Joe Snelson, CPBE, 8-VSB, Vice President
for the Society of Broadcast Engineers. Snelson is currently Vice
President of Engineering for the Meredith Local Media Group. He
is a member of the National Association of Broadcasters TV Technology
Committee. He also chairs the SBE National Frequency Coordination
Committee, and serves on the SBE National Certification Committee.
This webinar
is FREE to SBE members through sponsorship by Shure and $39 for
all others. Information on registering for the webinar is available
here.
|